| Common apparatus |
|---|
| Hydraulic system |
| Electronic components |
| Data acquisition |
| EMG monitoring |
| NLID Tools |
| Troubleshooting |
| Materials |
| Supine apparatus |
|---|
| Assembly procedure |
| Safety Measures |
| Components |
| Servovalve |
| Actuator |
| Potentiometer |
| Pressure Filter |
| Torque transducer |
| Boot |
| Literature |
| Computing resources |
|---|
| CVS |
| Ethics |
|---|
| SDS / Inventory |
|---|
Analysis of EMG system
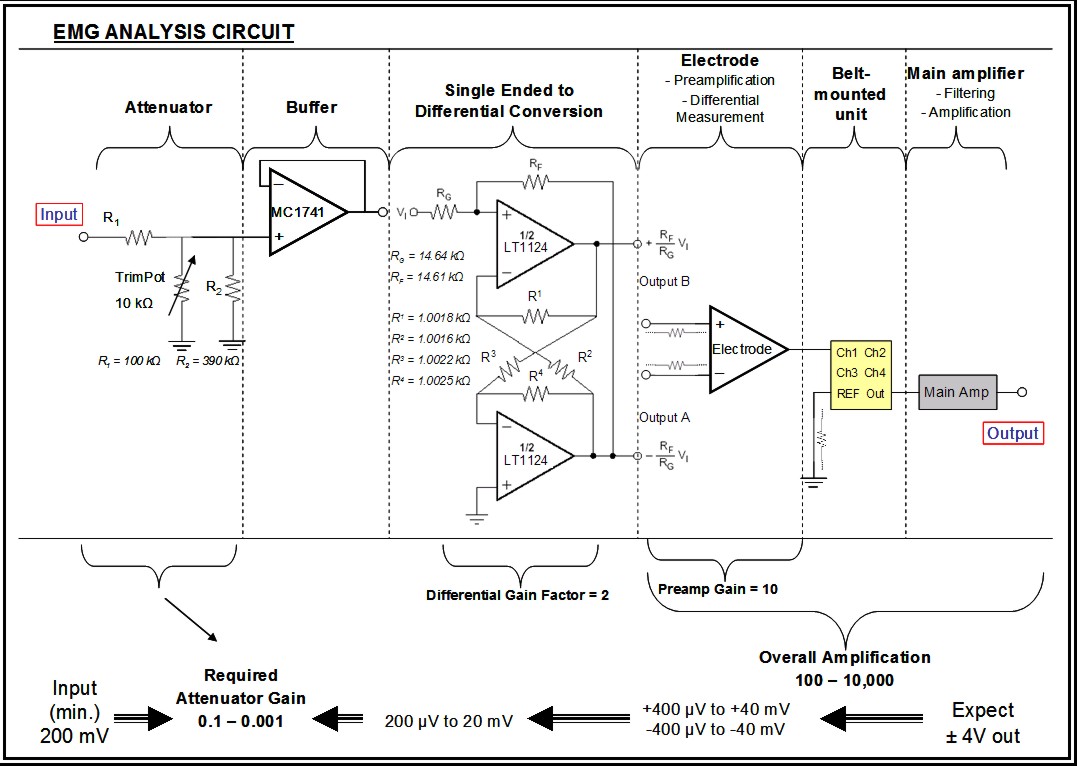
The following circuit was designed and built to test the overall Delsys EMG system (electrodes & amplifier):
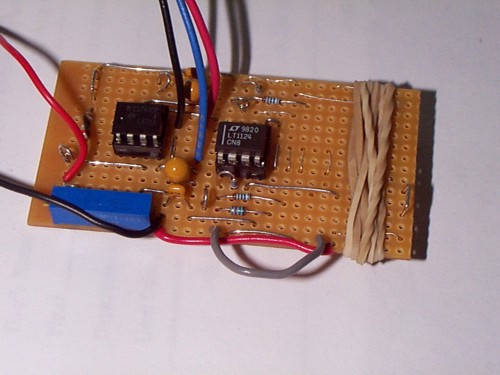
Electrode was held in placed against the contacts on the other side using the elastic band.
The attenuator was required since the dynamic analyzer and function generator cannot output a small enough signal to enable the testing of the highest gain 10k on the amplifier, since the output range is limited to ±5V (to be safe ±4V).
Single-ended to differential conversion was required as the electrode makes a differential measurement. The above circuit for the conversion was taken from the Burr-Brown Data Sheets for the DRV1100, which can be found on page 6 here (source: http://focus.ti.com/lit/ds/symlink/).
The circuit can be modified to allow for resistors to be placed before each of the electrode contacts & the reference electrode. This is necessary to test for a mismatch of inputs.
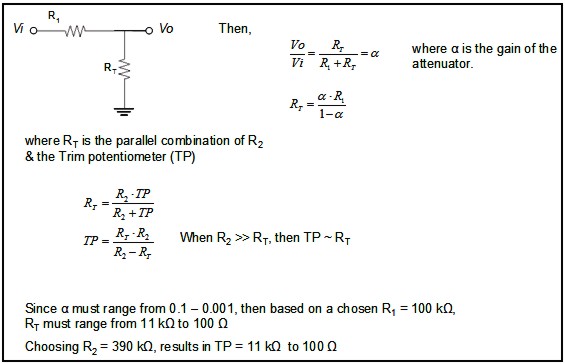
The following describes the equations used to determine the components required for the attenuator circuit:
We are only capable of examining the entire system as a whole (otherwise warranty would most likely be invalid if we opened up the electrode or amplifier).
Results
The circuit and the belt-mounted unit were placed into a copper box which was grounded to the op amps power supply ground.
Frequency response
The Dynamic Signal Analyzer was used to generate the input, as well as record the output. The source input settings were: Swept sine wave; Log sweep; Sweep down (from high to low frequencies). The input couple was set to DC. Channel 1 recorded either the output after the attenuator or at the differential output B or A, and Channel 2 measured the output from the main amplifier BNC output. The channels were set as grounded signals (rather than floating) in the analyzer, which means they were grounded to the analyzer chassis ground. The frequency measurements started at 1Hz and spanned 4 decades to 10 kHz. The input range was set to Auto Up & Down, which ensures the input signal level is at least half-scale but not greater than full scale and is allowed in either direction.
The attenuator gains were set to the following for the tests listed in the following:
Attenuator Gains: |
Rt (kΩ) |
R1(kΩ) |
Attenuator Gain |
All tests |
0.058 |
100.2 |
0.00058 |
Test #7 |
1.53 |
100.2 |
0.01504 |
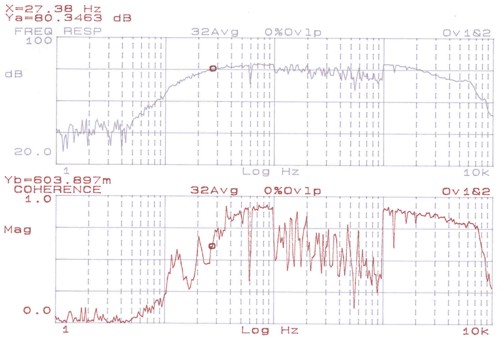
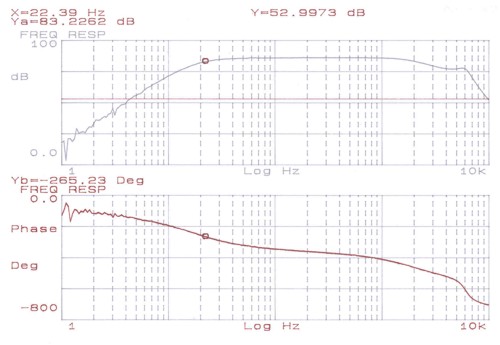
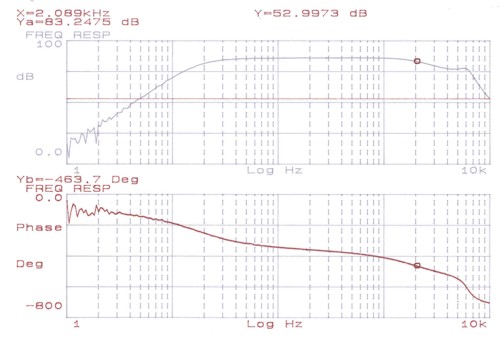
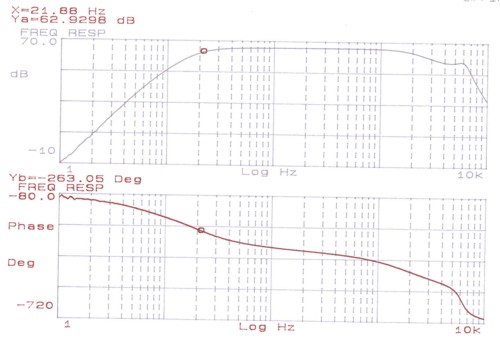
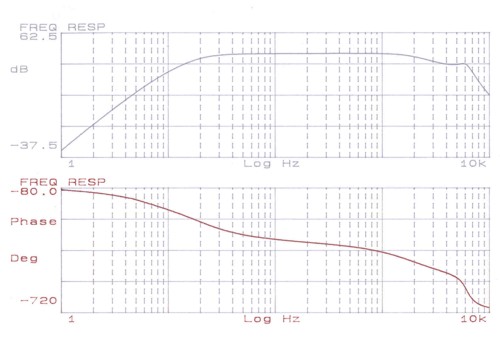
The tests that were performed for the frequency response can be found detailed in this Excel spreadsheet.The frequency responses for each channel were very similar. The responses at the three gain settings behaved as expected.
Plot of Test #1 Frequency Response: Channel 1; Gain = 10k
Plot of Test #2 Frequency Response: Channel 2; Gain = 10k
Plot of Test #6 Frequency Response: Channel 4; Gain = 1k
Plot of Test #7 Frequency Response: Channel 4; Gain = 100
Actual gains
The recorded gains measured exactly the same as expected from the gain settings.
Overall gain setting |
Expected Gain (dB) |
Recorded Gain (dB) [taking into account differential factor of 2] |
100 |
40 |
40 |
1000 |
60 |
60 |
10000 |
80 |
80 |
20 x log(Gain) Rec. Gain - [20 x log(2)] |
||
Coherence plots
The input was random noise & the mean averaging was done 32 times.
Test # |
Ch |
Gain set |
Input Ch1 |
Source Level (mVpk) |
Atten. Gain |
Input Level (mVpk) |
10 |
4 |
10k |
After attenuator |
200 |
0.00058 |
0.12 |
11 |
4 |
10k |
After attenuator |
350 |
0.00058 |
0.20 |
For test #10, there was low coherence in the passband and sudden drops at 100Hz & 1kHz. For the next test with a larger input signal, the coherence was closer to 1.0 in the passband, however there was still a weird sudden drop now at 10Hz. The coherence plots were deemed invalid because it appears that the analyzing device had undetermined limitations.
Plot of Test #10 Coherence: Channel 4; Gain = 10k